The CAR Strategy Team

Storm T. Randolph
Student Researcher
B.S. Computer Engineering, class of 2023
“I am a curious engineer, passionate about serving the community around me”

Amman F. Asfaw
Student Researcher
B.S. + M.S. Electrical Engineering, class of 2021
“I am an ethical engineer embodying respect, integrity, and commitment through servant leadership.”

Dr. Andrew R. Danowitz
Research Advisor
Associate Professor, Electrical Engineering Department
“The first step in improving learning outcomes Is creating an inclusive classroom.”

Dr. Jane L. Lehr
Research Advisor
Professor, Ethnic Studies and Women’s, Gender & Queer Studies
“Research like this show the necessity and power of changing not just how we teach but what we teach when we prioritize justice, equity, diversity & inclusion.”
WATCH:
The CAR Strategy
(4 minutes)
READ:
The CAR Strategy
(15 minutes)
Statistical Analysis of The CAR (Confront, Address, Replace) Strategy and its Efficacy when Applied to "Master-Slave" Terminology
Abstract
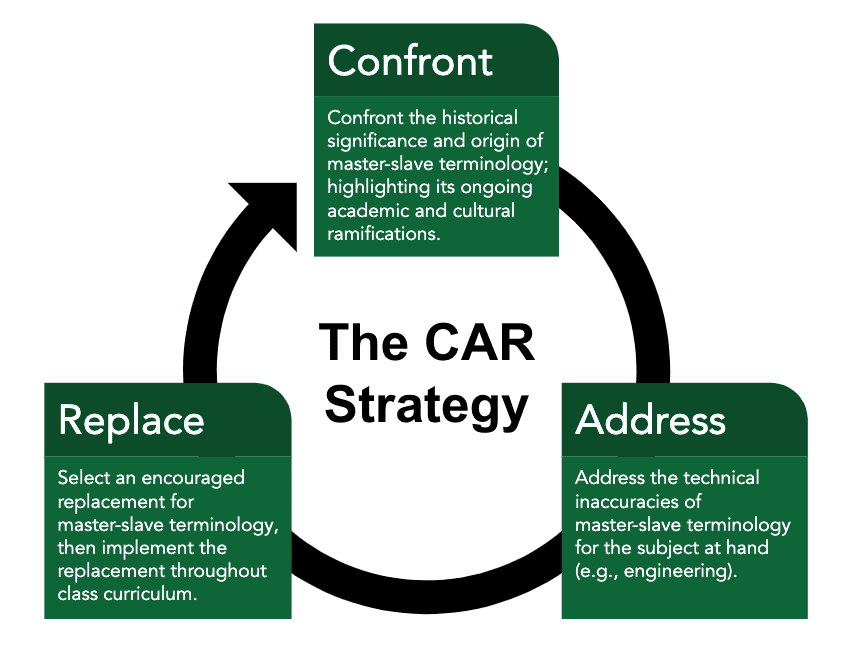
The CAR Strategy stands for: 1) confront; 2) address; 3) replace and aims to provide a framework for driving out exclusionary terminologies in engineering education such as “master-slave.” The first step is to confront the historical significance of “master-slave” terminology. The second step is to address the technical inaccuracies of “master-slave”. The third step is to replace “master-slave” with an optional replacement terminology.
This study reports specifically on student perceptions and the effectiveness of The CAR Strategy video piloted as a new pedagogy.
Executive Summary
- Ultimately, our data confirms The CAR Strategy is an effective pedagogy when applied to “master-slave” terminology.
- The researchers thus consider The CAR Strategy a promising pedagogy worth further research applied to other potentially problematic terminologies in engineering education such as “female-male” (connectors) and “blacklist-whitelist” (element selection).
- After running all 56 paired (pre-CAR and post-CAR) survey responses through 10 different paired-sample hypothesis tests, The CAR Strategy provided sufficient evidence to suggest it is statistically significant (at confidence levels < 5%) in promoting a more inclusive student experience.
- After plotting all 56 paired (pre-CAR and post-CAR) survey responses onto alluvial diagrams, The CAR Strategy primarily illustrated either a pro-inclusive shift in paired-sample responses or no shift in paired-sample responses.
- Of all 64 post-CAR respondents, 70% either agree or strongly agree The CAR Strategy is an effective framework for driving out iniquitous terminologies such as “master-slave” in engineering education.
- Of all 64 post-CAR respondents, 67% either agree or strongly agree they would like to see all professors use The CAR Strategy when applicable in their classes.
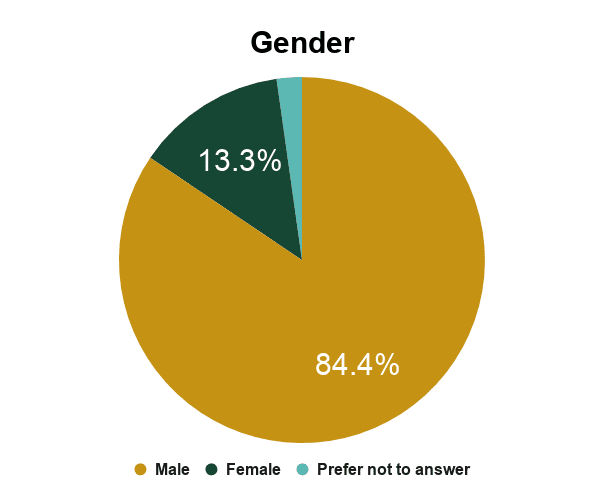
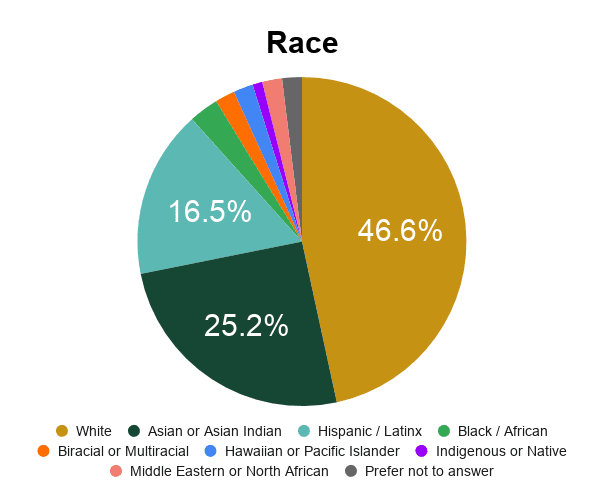
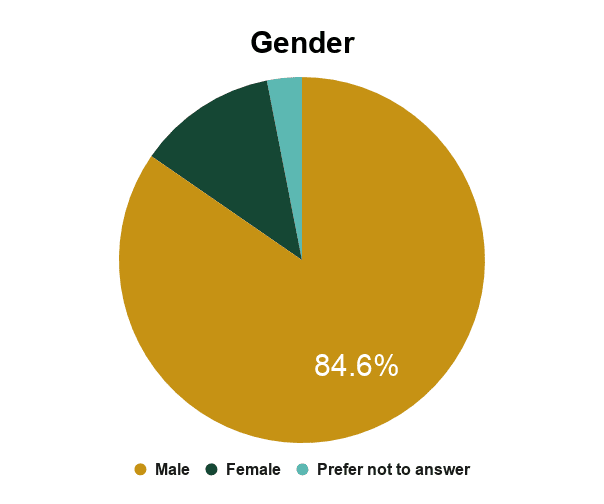
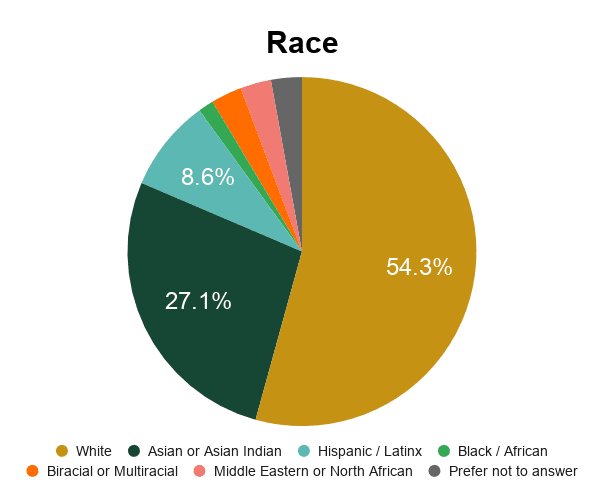
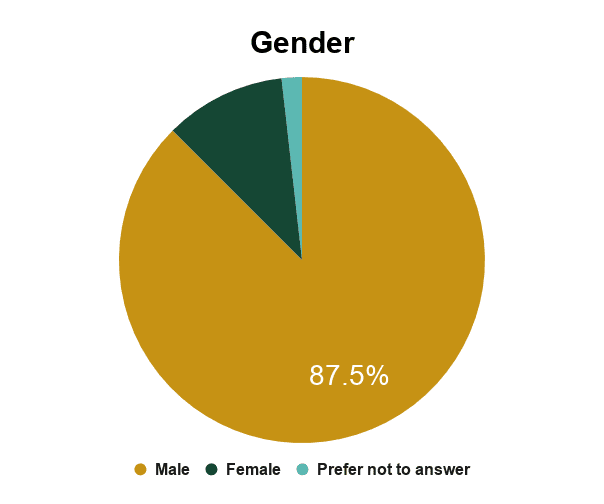
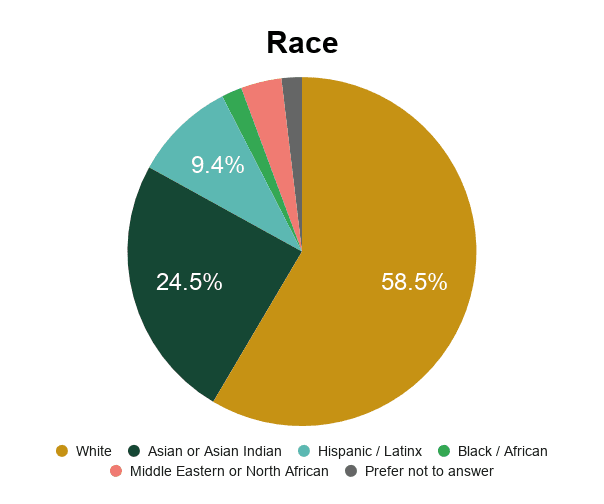
Demographics
All respondents were upper-division computer engineering students at Cal Poly San Luis Obispo.
Pre-CAR Survey (n=90)
Post-CAR Survey (n=65)
Pre-CAR & Post-CAR Linked (n=56)
Confront, Address, Replace
Pedagogy
Pre-CAR vs. Post CAR
Alluvial Diagrams
(Quantitative Data)
First, the engineering students voluntarily took the pre-CAR survey. Then, those students were instructed to watch The CAR Strategy video (4 minutes). Finally, the students were encouraged to complete the post-CAR Strategy survey.
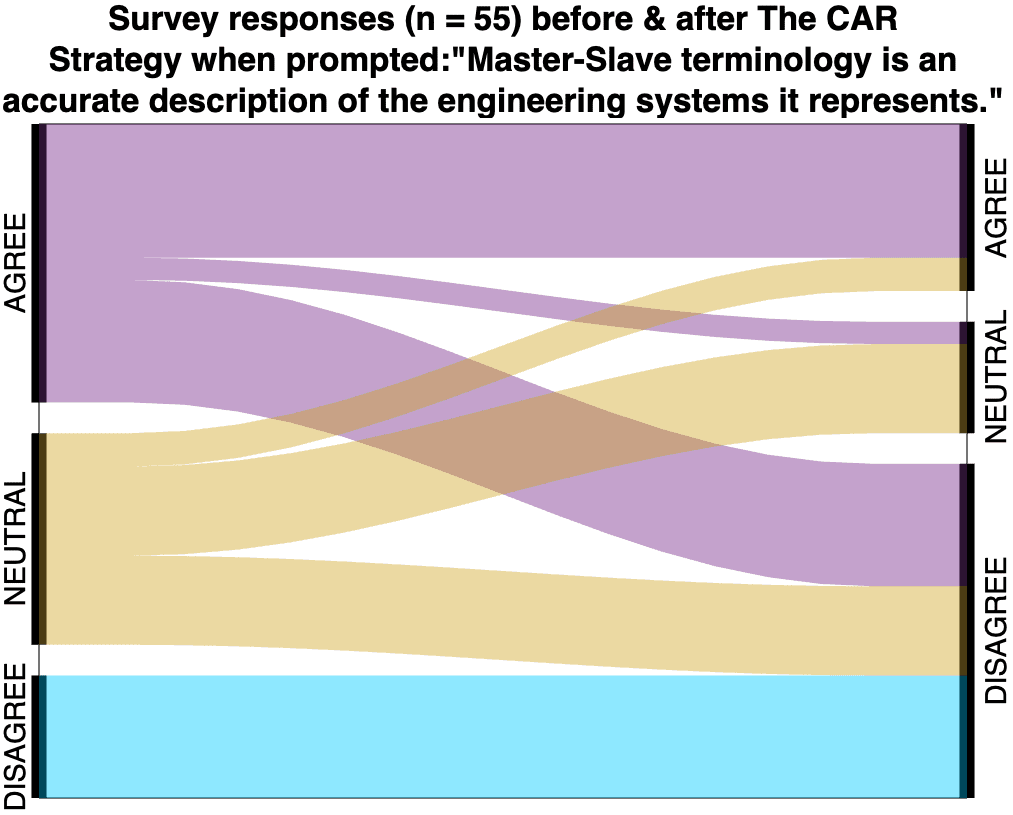
The alluvial plot above illustrates how The CAR Strategy influences more students to realize the inaccuracy of “master-slave” terminology in engineering. The CAR Strategy encourages students to think critically about the systemic nuances within their institutions. This is important because in order to eradicate Stereotype Threat and what Abdimalik Buul calls, “Curriculum Trauma,” students and instructors must normalize generational audits of our educational systems.
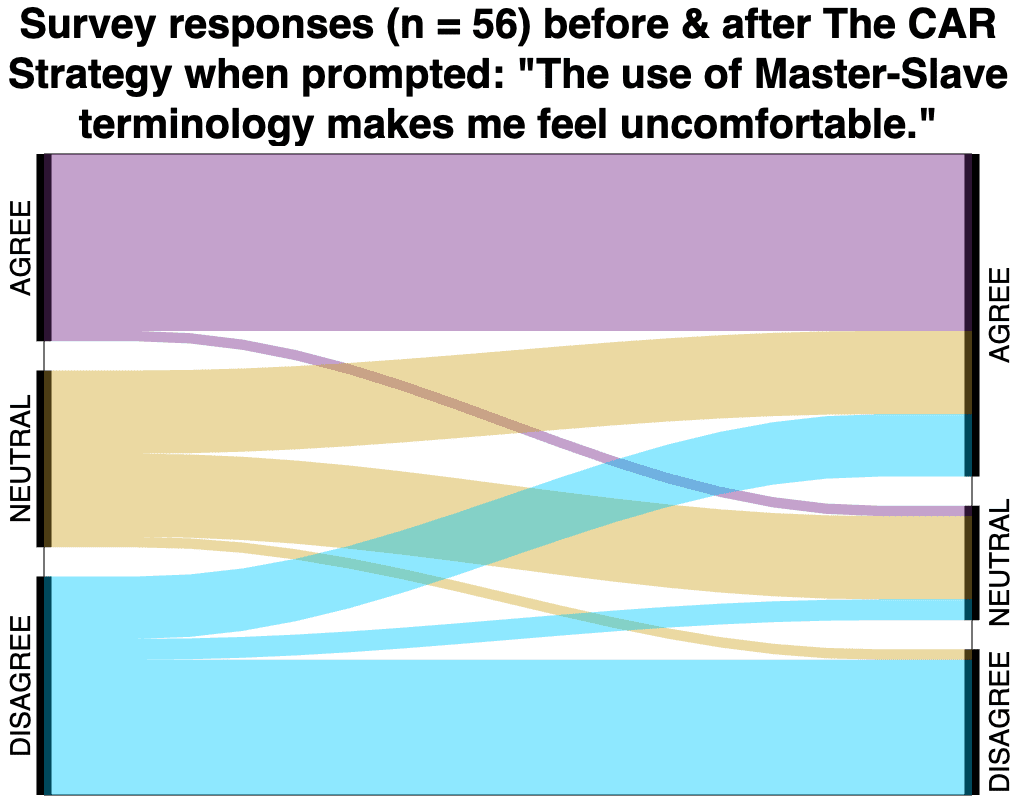
The alluvial plot above illustrates how The CAR Strategy evokes a healthy increase in discomfort amongst students when “master-slave” is used. Given the majority of students self-identify as male and/or white, this phenomenon can be likened to Megan Boler’s “pedagogy of discomfort” which challenges social, political, and emotional beliefs in order to create possibilities for individual and social transformation.
Scroll down to view MATLAB code and additional alluvial diagrams which exhibited pro-inclusive shifts among paired-sample responses.
Qualitative Data
In both the pre-CAR and post-CAR surveys, students were invited to elaborate on their Likert scale responses in their own words. Only 37% and 18% of open-ended questions received responses from students in the pre-CAR and post-CAR surveys, respectively. Below are some notable qualitative data points.
Pre-CAR Survey
- “We should question our casual use of the term master/slave in embedded systems.”
- “I believe it is better for teachers to address the elephant in the room instead of acting like [uncomfortable terminology] is no big deal.”
- “They should just come up with a replacement [terminology].”
- “This is definitely a sensitive topic but I think addressing it shows that we are culturally aware.”
Post-CAR Survey
- “[The CAR Strategy] can be applied to many other engineering or non engineering related fields.”
- “Hearing master-slave reminds me of sexual relationships more than historic racial situations. However, I can see how this affects other students.”
- “Confronting the issue and acknowledging it in the classroom is a valuable learning experience.”
- “[The CAR Strategy] brings up an important issue that we should have been talking about a while ago.”
The pre-CAR survey responses are significant because they confirm the demand amongst students for confronting, addressing, and replacing problems in educational institutions. The CAR Strategy is the supply to this demand.
Meanwhile, the post-CAR survey responses are informative because they help provide direction for future research related to The CAR Strategy and the gaps it currently does not address (e.g., “female-male” connectors).
Conclusion
We find The CAR Strategy to be an overall effective framework for driving out exclusionary terminologies in engineering education.
Of all 64 post-CAR respondents, 85.9% either agree or strongly agree The CAR Strategy appropriately confronted historical significance and origins of “master-slave” terminology.
Of all 64 post-CAR respondents, 68.2% either agree or strongly agree The CAR Strategy helped them realize technical inaccuracies of “master-slave” terminology.
Of all 64 post-CAR respondents, 58.7% either agree or strongly agree they were satisfied with the replacement terminology their professor selected through The CAR Strategy.
In closing, the majority of respondents agreed all three steps (Confront, Address, and Replace) were effective in their specific purposes when applied to “master-slave”. However, the Replace step warrants further research and improvement.
Supporters

Sponsored by:
The Cal Poly College of Engineering's Summer Undergraduate Research Program 2020.
Sponsored by:
The National Science Foundation with grant number HRD-1826490.

Supported by:
The Cal Poly Chapter of the National Society of Black Engineers.
*TRIGGER WARNING*
Current Examples of "Master-Slave" in Engineering
with a master and three slaves
daisy chained together.
cylinders in a gasoline-powered car.
missile system in "SLAVE" mode
(middle right).
Report showing an
"IOSlaveProcesser".
Github repositories...
(FYI: African-American
slaves were hung
on tree branches).
in architectural
designs of homes.
Acknowledgements
Dijon Kizzee, Rayshard Brooks, Carlos Carson, Tony McDade, George Floyd, Sean Reed, Michael Ramos, Daniel Prude, Breonna Taylor, Mannie Ellis, William Green, John Neville, Elijah McClain, Atatiana Jefferson, Javier Ambler, Sterling Higgins, EJ Bradford Jr., Chop Roundtree Jr., Chinedu Okobi, Botham Jean, Antwon Rose Jr., Saheed Vassell, Stephon Clark, Bijan Ghaisar, Aaron Bailey, Charleena Lyles, Fetus of Charleena Lyles, Jordan Edwards, Chad Robertson, Deborah Danner, Alfred Olango, Terrence Sterling, Korryn Gaines, Joseph Mann, Philando Castile, Alton Sterling, Betty Boo Jones, Quintonio LeGrier, Corey Jones, Jamar Clark, Bam Bam McDole, India Kager, Samuel DuBose, Sandra Bland, Brendon Glenn, Freddie Gray Jr., Walter Scott, Eric Harris, Phillip White, Mya Hall, Meagan Hockaday, Tony Robinson Jr., Janisha Fonville, Natasha McKenna, Jerame Reid, Rumain Brisbon, Tamir Rice, Akai Gurley, Tanisha Anderson, Dante Parker, Ezell Ford, Mike Brown Jr., John Crawford III, Tyree Woodson, Eric Garner, Dontre Hamilton, Victor White III, Gabriella Nevarez, Yvette Smith, McKenzie Cochran, Jordan Baker, Andy Lopez, Miriam Carey, BJ Williams, Jonathan Ferrell, Carlos Alcis, Larry Jackson Jr., Kyam Livingston, Clinton Allen, KiKi Gray, Kayla Moore, Jamaal Moore Sr., Johnnie Warren, Shelly Frey, Darnisha Harris, Timothy Russell, Malissa Williams, Noel Palanco, Reynaldo Cuevas, Chavis Carter, Alesia Thomas, Shantel Davis, Sharmel Edwards, Tamon Robinson, Ervin Jefferson III, Kendrec McDade, Rekia Boyd, Shereese Francis, Jersey Green, Wendell Allen, Nehemiah Dillard, Dante’ Price, Raymond Allen, Manual Loggins Jr., Ramarley Graham, Kenneth Chamberlain Sr., Alonzo Ashley, Derek Williams, Raheim Brown Jr., Reginald Doucet, Derrick Jones, DJ Henry Jr., Aiyana Stanley-Jones, Steven Washington, Aaron Campbell, and so many more unarmed Black and brown people killed by police, sheriff deputies, and security guards in America.
Additional Pre-CAR vs. Post-CAR Alluvial Diagrams
Matlab Code for Alluvial Diagrams
% Amman Asfaw
% Matlab Program to convert linked pre-CAR and post-CAR data
% into alluvial diagrams

clc; clear all;

% Linked pre-CAR and post-CAR data of a survey question
raw_data = [3   3
            1   4
            2   4
            1   1
            2   4
            1   2
            3   4
            2   1
            3   4
            3   3
            4   4
            1   2
            3   3
            2   4
            2   4
            4   3
            3   3
            4   4
            1   1
            4   4
            4   5
            4   5
            5   5
            5   5
            2   2
            2   3
            5   4
            5   5
            3   4
            3   2
            3   3
            2   2
            1   1
            3   4
            1   2
            2   2
            2   4
            4   4
            2   3
            5   5
            4   4
            3   3
            5   5
            1   2
            5   5
            5   4
            3   3
            2   2
            2   2
            4   4
            3   4
            3   5
            3   3
            3   4
            3   4
            4   4];

% Determine size of the raw data array
[numRows,numCols] = size(raw_data);

% Convert the raw_data into a size 3x3 array
calculate_alluvial_data(raw_data,numRows);


function data = calculate_alluvial_data(raw_data,numRows)
    % This function takes in the raw_data array (size nx2 where n is the
    % number of respondants) and its number of rows. It outputs the data
    % array (size 3x3) for the alluvialflow function.

    % This function starts with the first row of raw_data and looks at the
    % value of its first column to determine the pre-CAR category. Then it
    % looks at the second column of the same row to determine the post-CAR
    % category.

    % 1 == Strongly Disagree
    % 2 == Disagree
    % 3 == Neutral
    % 4 == Agree
    % 5 == Strongly Agree

    % If the pre-CAR value is 4 or 5 it will correlate to the 1st row of the 3x3 data array
    % If the pre-CAR value is 3 it will correlate to the 2nd row of the 3x3 data array
    % If the pre-CAR value is 1 or 2 it will correlate to the 3rd row of the 3x3 data array
    % If the post-CAR value is 4 or 5 it will correlate to the 1st column of the 3x3 data array
    % If the post-CAR value is 3 it will correlate to the 2nd column of the 3x3 data array
    % If the post-CAR value is 1 or 2 it will correlate to the 3rd column of the 3x3 data array

    data = zeros(3,3);
    rowCount=1;
    for n=rowCount:numRows

        % PRE-CAR = Strongly Agree
        if raw_data(n,1) == 5
            if raw_data(n,2) == 5 % post-CAR = Strongly Agree
                data(1,1) = data(1,1) + 1;
            elseif raw_data(n,2) == 4 % post-CAR = Agree
                data(1,1) = data(1,1) + 1;
            elseif raw_data(n,2) == 3 % post-CAR = Neutral
                data(1,2) = data(1,2) + 1;
            elseif raw_data(n,2) == 2 % post-CAR = Disagree
                data(1,3) = data(1,3) + 1;
            elseif raw_data(n,2) == 1 % post-CAR = Strongly Disagree
                data(1,3) = data(1,3) + 1;
            end

        % PRE-CAR = Agree
        elseif raw_data(n,1) == 4
            if raw_data(n,2) == 5 % post-CAR = Strongly Agree
                data(1,1) = data(1,1) + 1;
            elseif raw_data(n,2) == 4 % post-CAR = Agree
                data(1,1) = data(1,1) + 1;
            elseif raw_data(n,2) == 3 % post-CAR = Neutral
                data(1,2) = data(1,2) + 1;
            elseif raw_data(n,2) == 2 % post-CAR = Disagree
                data(1,3) = data(1,3) + 1;
            elseif raw_data(n,2) == 1 % post-CAR = Strongly Disagree
                data(1,3) = data(1,3) + 1;
            end

        % PRE-CAR = Neutral
        elseif raw_data(n,1) == 3
            if raw_data(n,2) == 5 % post-CAR = Strongly Agree
                data(2,1) = data(2,1) + 1;
            elseif raw_data(n,2) == 4 % post-CAR = Agree
                data(2,1) = data(2,1) + 1;
            elseif raw_data(n,2) == 3 % post-CAR = Neutral
                data(2,2) = data(2,2) + 1;
            elseif raw_data(n,2) == 2 % post-CAR = Disagree
                data(2,3) = data(2,3) + 1;
            elseif raw_data(n,2) == 1 % post-CAR = Strongly Disagree
                data(2,3) = data(2,3) + 1;
            end

        % PRE-CAR = Disagree
        elseif raw_data(n,1) == 2
            if raw_data(n,2) == 5 % post-CAR = Strongly Agree
                data(3,1) = data(3,1) + 1;
            elseif raw_data(n,2) == 4 % post-CAR = Agree
                data(3,1) = data(3,1) + 1;
            elseif raw_data(n,2) == 3 % post-CAR = Neutral
                data(3,2) = data(3,2) + 1;
            elseif raw_data(n,2) == 2 % post-CAR = Disagree
                data(3,3) = data(3,3) + 1;
            elseif raw_data(n,2) == 1 % post-CAR = Strongly Disagree
                data(3,3) = data(3,3) + 1;
            end

        % PRE-CAR = Strongly Disagree
        elseif raw_data(n,1) == 1
            if raw_data(n,2) == 5 % post-CAR = Strongly Agree
                data(3,1) = data(3,1) + 1;
            elseif raw_data(n,2) == 4 % post-CAR = Agree
                data(3,1) = data(3,1) + 1;
            elseif raw_data(n,2) == 3 % post-CAR = Neutral
                data(3,2) = data(3,2) + 1;
            elseif raw_data(n,2) == 2 % post-CAR = Disagree
                data(3,3) = data(3,3) + 1;
            elseif raw_data(n,2) == 1 % post-CAR = Strongly Disagree
                data(3,3) = data(3,3) + 1;
            end
        end
    n = n + 1;
    end
    %disp(data);
    left_labels = {'AGREE', 'NEUTRAL', 'DISAGREE'};
    right_labels = {'AGREE', 'NEUTRAL', 'DISAGREE'};
    alluvialflow(data, left_labels, right_labels, {'Survey responses (n = 56) before & after The CAR';'Strategy when prompted: "The use of Master-Slave';'terminology makes me feel uncomfortable."'});
end

function h = alluvialflow(data, left_labels, right_labels, chart_title)

%
% Plot an alluvial flow diagram.
% left_labels:  Names of categories to flow from.
% right_labels: Names of categories to flow to.
% data:         Matrix with size numel(left_labels) rows by
%               numel(right_labels) columns.
%
% Ideas for future work:
% 1. Get data from a MATLAB table, use table variable names and named rows
%    as labels.
% 2. Interface similar to the plot function, with name-value pairs, optional
%    parameters etc.
    h = gcf;
    clf
    % set(h, 'WindowStyle', 'Docked'); % DBG this helps reuse desktop space

    % Find axis dimensions and set them
    data_sum = sum(data(:));
    total_gap = 0.10 * data_sum;
    left_gap_size = total_gap / (size(data, 1)-1);
    right_gap_size = total_gap / (size(data, 2)-1);
    y_height = data_sum + total_gap;
    x_left = 0;
    x_right = 1;
    axis([x_left, x_right, 0, y_height]) % Set limits
    axis ij % origin is top left
    axis off

    % grid minor % DBG

    hold on
    patch([0 0 1 1], [0 y_height y_height 0], 'w');

    % Plot left categories - one per row
    left_category_sizes = sum(data, 2)';

    % These are the top points for each left category,
    % with gaps added.
    left_category_points = [0 cumsum(left_category_sizes)] + ...
        (0:numel(left_category_sizes)) .* left_gap_size;
    left_category_points(end) = [];

    % plot left category bars
    plot(zeros(2, numel(left_category_points)), [left_category_points; (left_category_points + left_category_sizes)], 'k', 'LineWidth',11);

    % DBG plot left ticks
    %left_category_tick_starts = zeros(size(left_category_points)) - 0.01;
    %left_category_tick_ends = left_category_tick_starts + 0.02;
    %plot([left_category_tick_starts; left_category_tick_ends], ...
    %     [left_category_points; left_category_points], 'b-');

    % Plot right categories - one per column
    right_category_sizes = sum(data, 1);
    % These are the top points for each right category,
    % with gaps added.
    right_category_points = [0 cumsum(right_category_sizes)] + ...
        (0:numel(right_category_sizes)) .* right_gap_size;
    right_category_points(end) = [];

    % plot right category bars
    plot(ones(2, numel(right_category_points)), [right_category_points; (right_category_points + right_category_sizes)], 'k', 'LineWidth',11);
    % DBG plot right ticks
    %right_category_tick_ends = ones(size(right_category_points)) + 0.01;
    %right_category_tick_starts = right_category_tick_ends - 0.02;
    %plot([right_category_tick_starts; right_category_tick_ends], ...
    %     [right_category_points; right_category_points], 'b-');

    %
    % Draw the patches, an entire left category at a time
    %

    % Color selection
    patch_colors = [  0 0.8 1;
                      0.4940 0.1840 0.5560;
                      0.8350 0.6780 0.1840];
    num_colors = size(patch_colors, 1);
    right_columns_so_far = right_category_points(1:end); % Start at the beginning of each right category and stack as we go.
    patches_per_left_category = size(data, 2);
    for k_left = 1:size(data, 1) % for each row
        color = patch_colors(mod(k_left,num_colors)+1, :);

        %
        % Calculate the coordinates for all the patches split by the
        % current left category
        %

        % Split the left category
        left_patch_points = [0 cumsum(data(k_left, :))] + left_category_points(k_left);
        patch_top_lefts = left_patch_points(1:end-1);
        patch_bottom_lefts = left_patch_points(2:end);

        % Compute and stack up slice of each right category
        patch_top_rights = right_columns_so_far;
        patch_bottom_rights = patch_top_rights + data(k_left, :);
        right_columns_so_far = patch_bottom_rights;

        %
        % Plot the patches
        %

        % X coordinates of patch corners
        [bottom_curves_x, bottom_curves_y] = get_curves(0.1, patch_bottom_lefts, 0.9, patch_bottom_rights);
        [top_curves_x,    top_curves_y]    = get_curves(0.9, patch_top_rights,   0.1, patch_top_lefts);
        X = [ ...
            repmat([0; 0], 1, patches_per_left_category); % Top left, bottom left
            bottom_curves_x;
            repmat([1; 1], 1, patches_per_left_category); % Bottom right, top right
            top_curves_x
            ];


        % Y coordinates of patch corners
        Y = [ ...
            patch_top_lefts;
            patch_bottom_lefts;
            bottom_curves_y;
            patch_bottom_rights;
            patch_top_rights;
            top_curves_y
            ];

        patch('XData', X, 'YData', Y, 'FaceColor', color, 'FaceAlpha', .4, 'EdgeColor', 'none');
    end % for each row

    % Place left labels
    text(zeros(1, size(data, 1)) - 0.01, ...
         left_category_points + left_category_sizes./2, ...
         left_labels, 'FontSize', 20, 'HorizontalAlignment', 'center', 'VerticalAlignment', 'bottom', 'Rotation', 90);

    % Place right labels
    text(ones(1, size(data, 2)) + 0.01, ...
         right_category_points + right_category_sizes./2, ...
         right_labels, 'FontSize', 20, 'HorizontalAlignment', 'center', 'VerticalAlignment', 'top', 'Rotation', 90);

    title(chart_title, 'FontSize', 30);
end % alluvialflow
function [x, y] = get_curves(x1, y1, x2, y2)
% x1, x2: scalar x coordinates of line start, end
% y1, y2: vectors of y coordinates of line start/ends
    Npoints = 15;
    t = linspace(0, pi, Npoints);
    c = (1-cos(t))./2; % Normalized curve

    Ncurves = numel(y1);
	% Starting R2016b, the following line could be written simply as:
    %   y = y1 + (y2 - y1) .* c';
    y = repmat(y1, Npoints, 1) + repmat(y2 - y1, Npoints,1) .* repmat(c', 1, Ncurves);
    x = repmat(linspace(x1, x2, Npoints)', 1, Ncurves);
end  % get_curve