Thermal Detection for Free Flight

Thermals are regions of rising hot air formed on the ground through the warming of the surface by the sun. In this project we train an algorithm to automatically predict the location of a thermal to allow for longer and environmental friendly flights

Our Team

This the excellent team of Computer Science and Software Engineering Students

Jake Tallman

Researcher

Paragliding pilot first, computer engineer second.

Working on Machine Learning and specifically Deep Learning related projects for an eternity (in Machine Learning sense).
When I’m not coding you can find me somewhere across America jumping off a mountain with my wing.

David Anchih Yu

Researcher

I’m a second-year Computer Science student interested in machine learning research. My current goal is to expand my undergraduate research experience and pursue a graduate school degree.

I am Lockheed Martin Endowed Associate Professor, Computer Science/Computer Engineering Department at CalPoly. PhD in Computer engineering by Santa Clara University and undergraduate bachelor from Universidad Politecnica de Valencia

About Jake Tallman

Jake Tallman

Computer Science and Software Engineering

I am originally from Montana and I came to California to study computers. In my time here I feel I have accomplished a lot but this project is very close to my heart. It combines my knowledge of computer science with a drive for adventure and new heights (literally).
My specialties are Machine Learning, Embedded Systems and Web Dev.

About David Anchih Yu

David Anchih Yu

Computer Science and Software Engineering

I am a sophomore studying Computer Science. I’m interested in machine learning research and am currently focusing on utilizing neural networks to forecast weather. My other hobbies include 3D printing, working out, and developing quirky skills. 

Acknowledgements

We want to acknowledge the support given to this project by Northrop Grumman in support of the Summer 2020 Research Project at CalPoly 

Project Video

Play Video

Abstract

Thermals

Thermals are regions of rising hot air formed on the ground through the warming of the surface by the sun. Thermals are commonly used by birds and glider pilots to extend flight duration, increase cross-country distance, or simply to conserve energy. This kind of powerless flight using natural sources of lift is called soaring. Once a thermal is encountered, the pilot flies in circles to keep within the thermal, so gaining altitude before flying off to the next thermal and towards the destination. Estimating thermals is not an easy task, pilots look for different indicators like color variation on the ground because the difference in the amount of heat absorbed by the ground varies based on the color/composition, birds circling in an area, and certain types of cloud formations (cumulus clouds). The above methods are not always reliable enough and pilots study the conditions for thermals by estimating solar heating of ground (cloud cover and time year/date) and also the lapse rate and dew point of air. 

Main Project Goal

  • In this paper, we present a Machine Learning based solution to forecast thermals.
  • Prediction based on: Previous recordings of flights made by Pilots. In they upload their flights to databases.
  • Use the above mention flight data uploaded to determine where the pilot encountered thermals and together with other information (weather, terrain, and others)  train an algorithm to automatically predict the location of a thermal 

Introduction

Glider/free-flight pilots seeking to perform cross country flights rely heavily on thermals to maintain altitude as a paraglider or hang glider does not have any kind of propulsion (thus free-flight). To improve flight time of  gliders (fixed-wing aircraft that is supported in flight by the dynamic reaction of the air against its lifting surfaces) and other free flight apparatus which do not need an engine to fly, detecting thermals and other forms of lift is fundamental. There are a variety of ways to find potential thermals however they can be unreliable and vary by location and weather. Losing lift on a long flight and being unable to find another source of lift can leave a pilot in a frustrating or dangerous situation needing to quickly find a landing zone. There are only two guaranteed indicators of a thermal; a cumulus cloud and birds or pilots already soaring and gaining lift. We intend to provide a new way to help pilots predict, with accuracy, thermal locations or lack thereof to provide a rewarding and safe flying experience. 

Ridge Soaring. Ridge lift occurs when wind strikes a cliff face or ridge line at an orthogonal direction causing an upward force of air that can be flown in indefinitely so long as wind conditions maintain.

Thermal Soaring. Thermals are regions of rising hot air formed on the ground through the warming of the surface by the sun. 

Aside from improving the state of free flight, this research will also help propel deep learning on environmental input. In this research we are experimenting on layering satellite imagery along with weather data as input to try and predict weather patterns that cannot easily be detected. This would typically be done with a mathematical or statistics model. Glider pilots encounter a few kinds of lift, however thermals, ridge lift and convergence are the most common. 

Northrop Grumman

Sponsor Logo here

This project is sponsored by. Northrop Grupmman

Implementation

Deep Learning Algorithm Input Data

Thermal detection needs data for terrain, weather conditions, and previous occurrences of thermals on a certain locations. 

Sample of how to record a Flight as a Trac file overimposed over a KZM google map file.

Flight Path over a satellite terrain image with superimposed temperature 

There are correlation visible in different colors and shapes with the thermals found on the flight path recorded

  • Flight Data information.
    To train a neural network(NN), as is the focus of this paper, we need the input data to the NN to be labeled for true occurrences of thermals, to obtain this confirmed cases of thermals we use database of previous flights recorded by gliders. Glider pilots record their flights using Track log files in the standard IGC format.
  • Satellite data. GFS, NOAA CFSR, MODIS

    The weather related inputs we decided on are: temperature 2m above the ground (gfs), downward shortwave radiation flux (gfs), wind horizontal and vertical components (gfs), upward longwave radiation flux (cfsr), lifted index(cfsr), and high res surface temperature (modis). 

    •  CFSR, Climate Forecast System Reanalysis is another weather prediction system provided by NCEP. “It is a global, high resolution, coupled atmosphere-ocean-land surface-sea ice system designed to provide the best estimate of the state of these coupled domains over this period.”

    • MODIS,  is provided by NASA space crafts to give measurements of atmospheric and surface conditions. We are using a Modis data set: Terra Land Surface Temperature and Emissivity Daily Global 1km that is based in part off of the Modis albedo readings. This data set gives us with very high resolution ground temperature. 

    • GFS provides global coverage at a resolution of 18 miles. For hisotrical predictions we use predictions of forecast hour 0 meaning they are recorded at the time of the flight.

  • We combine all the above data together on an image with 11 layers. Where each layer represents the main weather, terrain and previous occurrences of thermals.

Deep Learning Algorithm Configuration

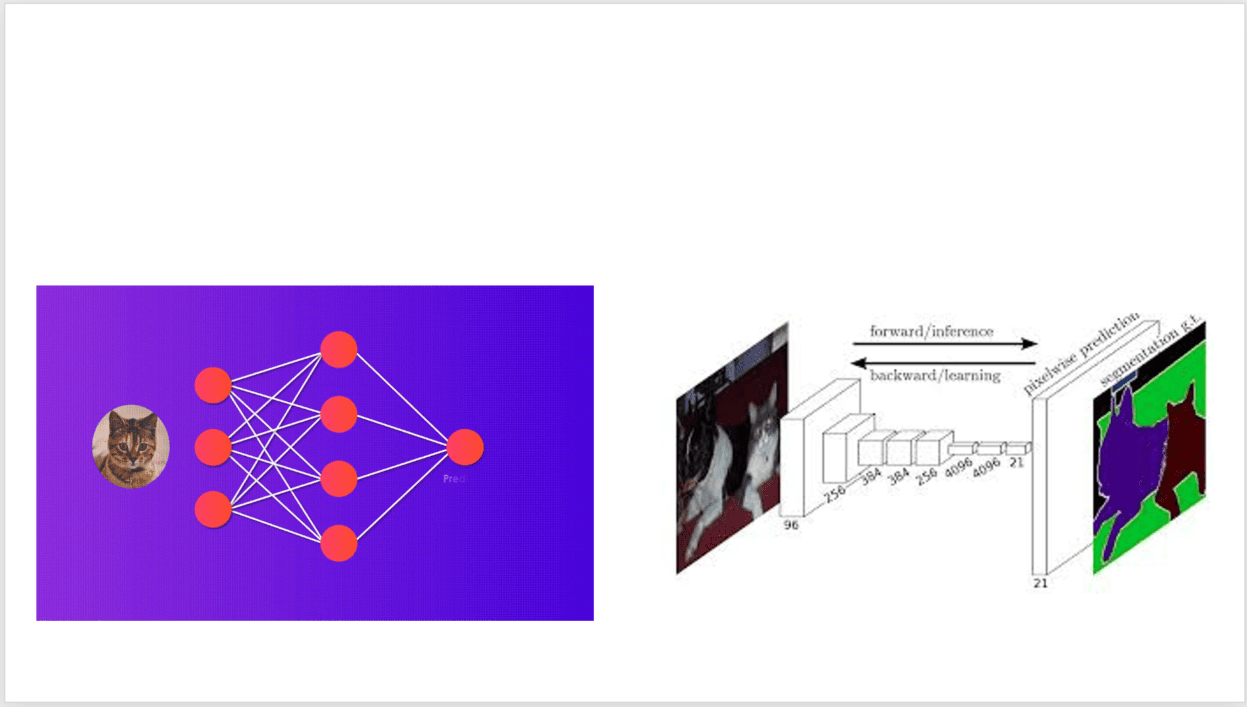
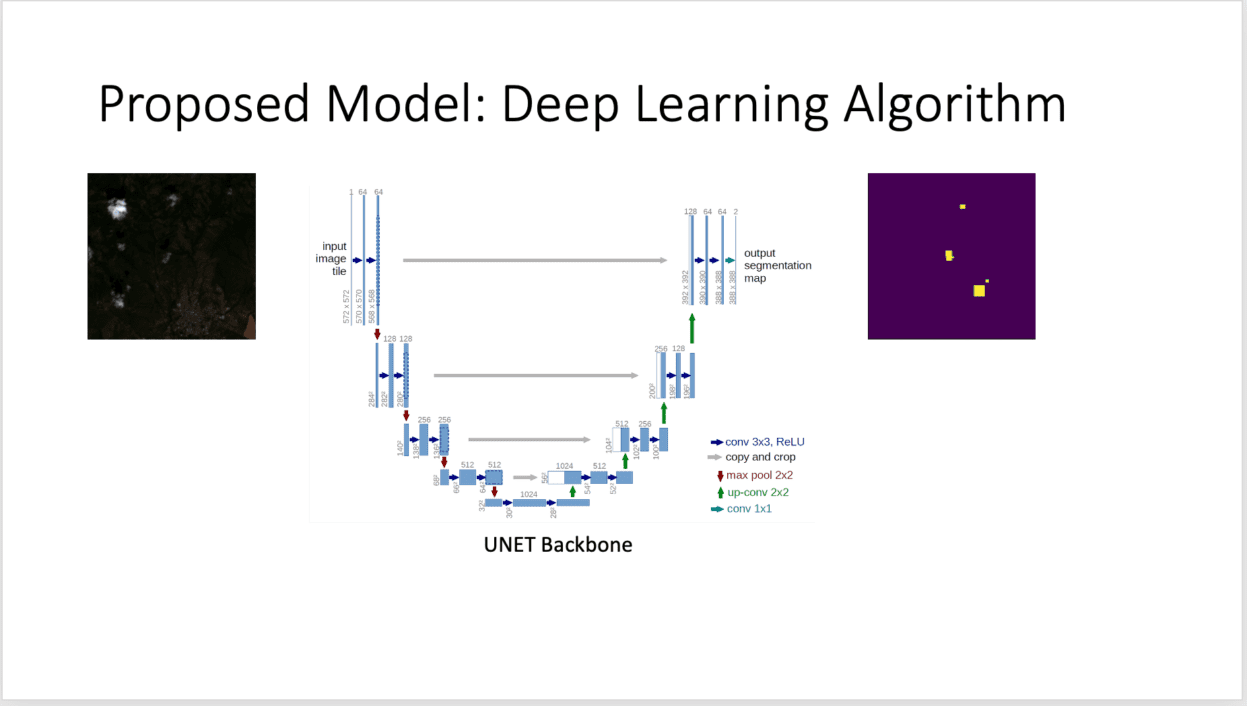
Based on U-Net Segmentation

  •  Initialization: He
  •  Image size: U-net was designed for images of size 572 × 572 × 3, our images are 256 x 245 x 11.
  •   Batch size: 32. To fit on GPU memory
  •   Activation: Relu
  • Optimizer: Adam optimizer Over Gradient Descent because it converges faster. 
  •   Loss function: Loss function: Soft Dice + Binary Cross Entropy
    The loss based on the Dice coefficient is commonly used for image segmentation as it allows coping with class imbalance.
    Given the evaluation metric is the mean Jaccard index over classes, it would be ideal to use Jaccard index as the loss function. Unfortunately, Jaccard index is not differentiable. Soft Jaccard index instead is differentiable and is close to Jaccard index in very confident predictions. A combination of cross entropy (H) and soft Jaccard index (J), L = H -log(J), is used as the loss function.
  •   To make sure we don’t overfit we decided to use dropout of x every y layer
  •  We also use Keras callbacks to implement: Learning rate decay, early stopping if the validation loss does not improve for 10 continues epochs or reaches the desired 
  • Augmentation We use spacial augmentation only. Rotation, flipping, and zoom.
Experiments 
Models: The models we tested against this dataset are the U-net, Unet ++, and a fully connected CNN. We chose the Unet and Unet++ for their performance in other segmentation problems as well as their popularity in satellite image segmentation. We also used the Tiramisu model for its success in segmentation and as a comparison to the Unet models.
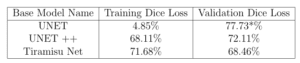
Despite having a similar validation error the Unet is the only model that would fully converge on the training set. This gave promise for its ability to learn the data and hopefully be able to overcome the issue of over fitting. 
As the Unet converged the validation error would fluctuate largely from , to improve this we are creating more training flights from different world areas.

Results
The input will be and image with 11 channels the output will be a probability map therefore the best nn configuration to adapt to out needs is the unet.

Sample Output of the Prediction Algorithm (next Figure). Left tiles are the satellite image, the right tile represent the location of thermals on those tiles

References

Full Paper and references can be found here:

https://www.overleaf.com/read/sktvzbzghdsy


Project Slides

Team Members
What is a Thermal
Thermal Soaring
Previous Models
Segmentation Using Deep Learning
Input Data
U-Net Configuration
Results
Acknowledgments
Previous
Next

Project Slides

Share

Share on facebook
Share on twitter
Share on linkedin

Coronavirus Update and Resources