Photovoltaic Array Soiling Reduction through Optimization of Stowing Angle

Image of flat solar panel at the Gold Tree Solar Farm with noticeable soiling
This project sets to improve energy production for single axis tracker utility PV plants by reducing soiling through the nighttime tilt angle. The current industry tendency is to stow horizontal.

About Me

Head-shot of author, Shayla Schoensee

Shayla Schoensee

Mechanical Engineering

I am a 4th year undergraduate student at Cal Poly, originally from Boise, ID. Renewable energy has been a passion of mine and a strong motivator for me to pursue mechanical engineering.

Acknowledgements

Special thanks to my advisor, Professor Dale Dolan of Electrical Engineering for providing guidance through the world of research and solar. It was very enriching working with a professor of another major.

PV Soiling Reduction via Night Stow Angle

Problem

Uniform Soiling: Power loss through decrease in irradiance (1.4% to 19%  loss/week)

Nonuniform (Corner) Soiling: Power loss through partial shading of cells, preventing current flow (9% loss/25% shade)

Image shows different type of soiling. Dust, bird dropping, and soot signify losses in power

Balance effects of tilt angle on soiling while also considering wind loading, rain and humidity. Preliminary background research suggest max tilt angle reduces soiling most. The PV farm owners express concerns of failure at higher tilt angles due to wind.

Wind Analysis

Loads from wind can be extracted through lift, drag, and normal force coefficients. 

Schematic of resulting drag, lift, and normal force coefficients from wind direction on angled solar panel. Lift up, drag in direction of wind, normal force perpendicular to panel

Site peak wind speeds and local airport data determined maximum wind speeds. Normal force coefficients used from multiple wind tunnel studies and static loads found.

Spider plot of peak wind speed along with direction at solar farm during the nighttime. No reported winds over 45 mph

Wind speed and direction analysis signifies primary nighttime winds from East and West. Max speed about 45 mph. 

Plot of pressure on solar panel and coefficient of normal force verses panel tilt angle

The linear correlation of pressure and normal force to tilt angle is expected. Normal force coefficients extracted from older sources are more conservative.

Failures seen at low wind speeds due to dynamic instabilities. Flat to low tilt susceptible to torsional galloping and flutter. Support achieved to allow stow at high tilt angles

Image of failed PV row due to twisting caused by torsional galloping

Methodology

The maximum tilt angle 52 degrees east (away from dirt road) for nighttime stowing was selected to reduce soiling. All trackers adopted this setting except for Y1 and Z4 remained flat to compare soiling effects. Soiling sensors are located on a flat stow row and tilted stow row. Three methods are used to compare:

  • Visual Inspection
  • Soiling Sensor Irradiance Loss
  • Inverter Energy Production

Following drawing shows the layout of arrays and key locations used in this study

Drawing of solar farm containing 7 arrays. Soiling sensors located on South side and middle of farm

Visual Inspection

Up close image of module and image of most dirty module corner for modules positioned flat all day and night due to tracker being broken. Heavy uniform and corner soiling is seen
Up close image of module and image of most dirty module corner for modules positioned flat at night which was original positioning prior to study. medium uniform and corner soiling is seen
Up close image of module and image of most dirty module corner for modules positioned at 52 degrees at night. Low uniform and little to no corner soiling is seen

Irradiance Loss

Plot of % irradiance loss over time from flat night stow soiling sensor and high tilt soiling sensor. Percent difference between the two is also shown which increases, then decreases, then greatly increases during times of bad air quality/ash

Procedure: Both cells cleaned on August 11th. Historical data analyzed to determine soiling biases due to location. Normalized tilted to flat

Equation of % soiling loss/irradiance loss is equal to 100%*(1-irradiance dirty cell/irradiance clean cell)

Result: Roughly 20% less irradiance losses in first week due to soiling for 52 degrees east stow compared to flat (0 degrees) nighttime stow.

Energy Production

Plot of % change of the ratio of tilted/flat energy production over time. Increase in ratio since August 1st when panels were cleaned was seen for 3 sets of inverters.

Procedure: Compare energy produced between tilted and flat stow rows for mornings (before 9 am) in which were sunny. Study limited to morning due to irradiances in timeframe maxing out inverter power.

Result: Overall 5% to 15% more power produced for tilted stow arrays compared to flat stow for morning period.

Conclusion

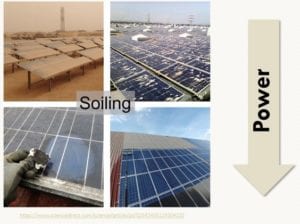
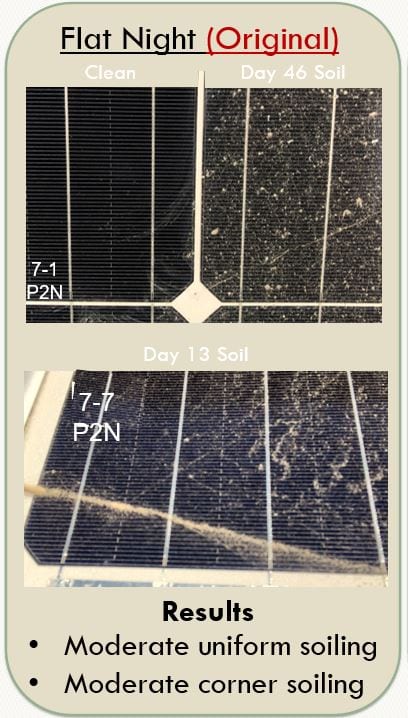
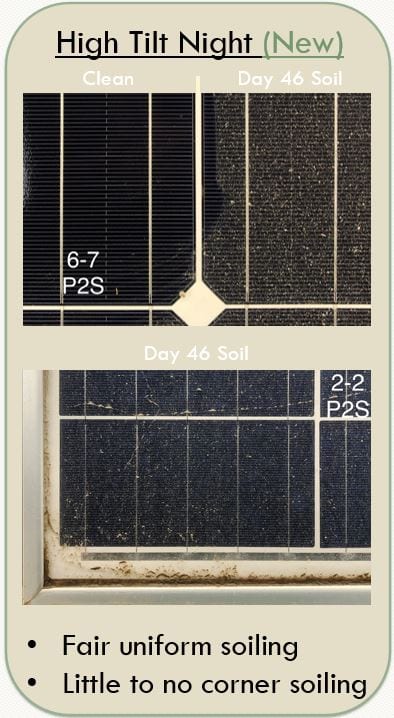
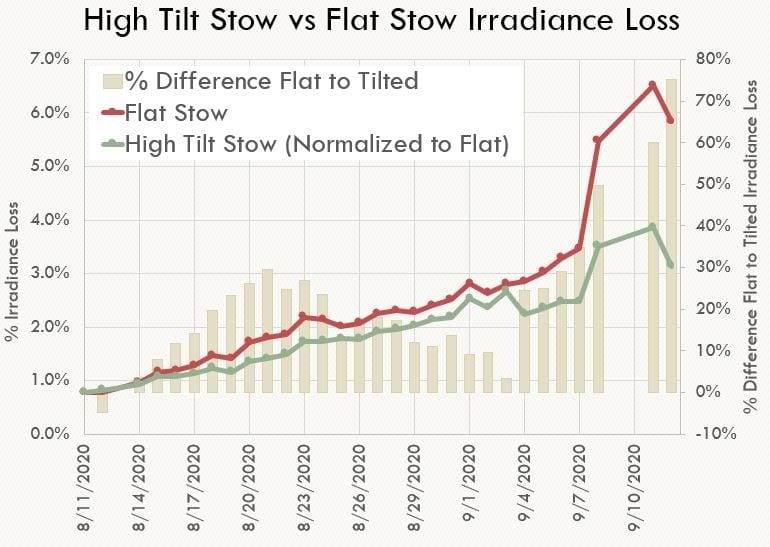
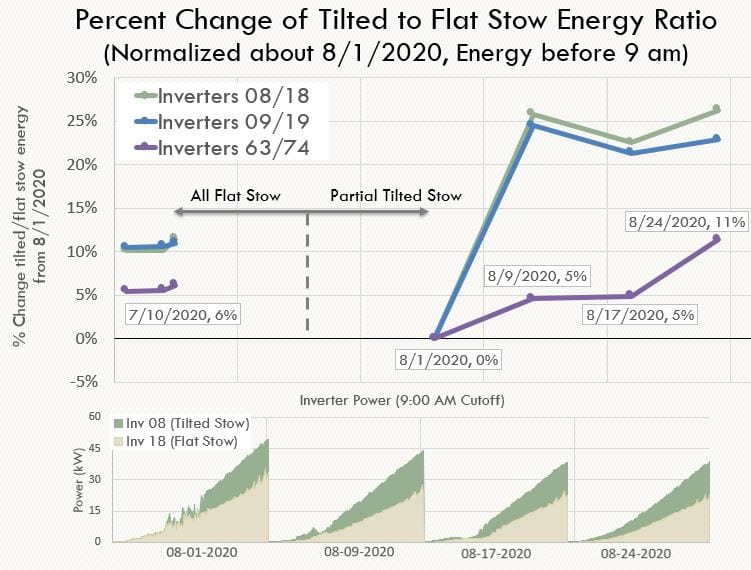
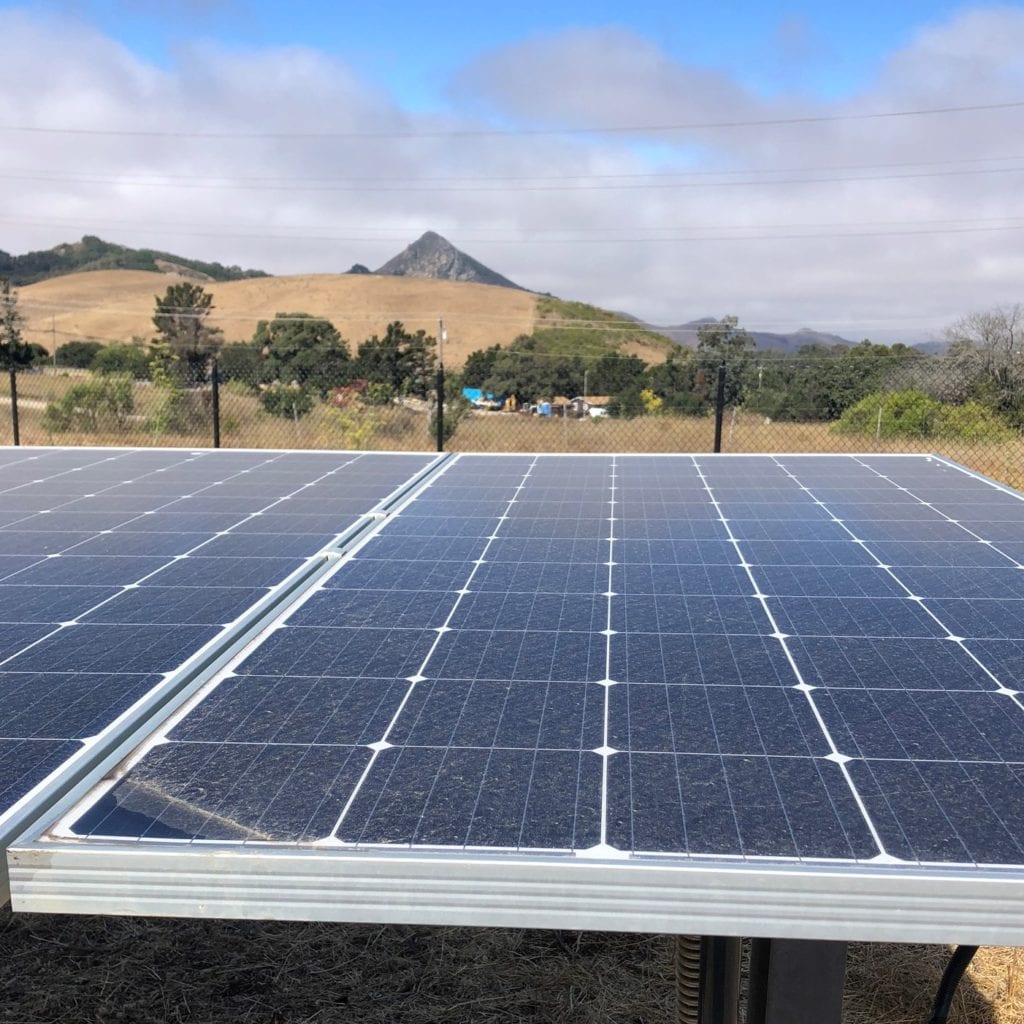
Adjusting the single axis trackers from a nighttime stow angle of 0 degrees  to 52 degrees east resulted in less soiling. This is supported via irradiance and power comparisons as well as visual inspection.

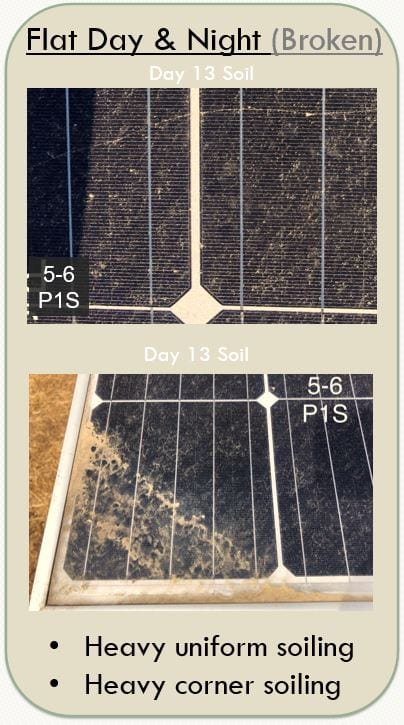
The high tilt rows retained 20% greater irradiances and showed little to no corner soiling, resulting in 5%-15% more power.

Limitations of the study consisted of small data sets due to inverter’s power capacities being reached as well as frequent foggy mornings. Additionally, section Y2 could not be compared to Y1 due to Y2 tracker being misaligned for 8 days.

Future work should be conducted to confirm the quantified losses through larger data sets.

High Tilt Stow > Flat Stow

Share

Share on facebook
Share on twitter
Share on linkedin

Coronavirus Update and Resources