Psychological Influences on Thermal Comfort Perception in Higher Education​

This research proposes to investigate occupant satisfaction and what influences their perception of thermal comfort, specifically the psychological effects on thermal comfort, and asks the question of whether we can influence people to believe that the room conditions are acceptable.​ Data analytics is used to analyze historical data and building rooms were modeled using Design Builder. Using the models, and historical trends along with the mobile/web app to collect thermal comfort information, we will be able to determine the best thermal conditions for classrooms.

Our Team

Bora Joo

Surp 2020
Web/mobile app Sub-group

Major: Computer Science

Planned Graduation: June 2023

Summer Location: La Crescenta, CA (Los Angeles County)

Fun Fact: I like collecting things related to Rilakkuma, which is a cute Japanese bear character.

Michaella Ochotorena

SURP 2020
Room condition modeling Sub-group

Major: General Engineering (concentration: Sustainable Energy)

Planned Graduation: June 2022

Summer Location: Elk Grove, CA

Fun Fact: I was born in NYC!

Tarnvir Dhaliwal

Historical trends Sub-group

Major: Biomedical Engineering

Planned Graduation: June 2023

Summer Location: Sacramento, CA

Fun Fact: My favorite color is lilac, but my favorite color name is lavender!

Khanhthy Le

Mobile/Web App Sub-group

Major: Electrical Engineering

Planned Graduation: June 2023

Summer Location: San Jose, CA

Fun Fact: I can’t whistle

Carly Tudor

Historical Trends Sub-group

Major: Mechanical Engineering

Planned Graduation: June 2022

Summer Location: Bellevue, WA

Fun Fact: I am a fraternal twin! We were both pretty set on going to different universities, which is what happened. It’s funny though because somehow, we both ended up pursuing the same major!

Victoria Vega

Room Condition modeling Sub-group

Major: Mechanical Engineering

Planned Graduation: June 2021

Summer Location: Lake Elsinore, CA

Fun Fact: I have traveled to 23 different US states (over the course of many summer road trips). But, I have only been out of the country once!

Carson Hubred

Mentor

Major: industrial Engineering

Planned Graduation: December 2020

Summer Location: Granite Bay & Long Beach, CA

Fun Fact: I once lived in a tent for nine weeks while working in Tahoe National Forest as a camp counselor.

Acknowledgements

We want to thank Dr. Mott for being an amazing project advisor. Her constant support and guidance has made this project a valuable learning experience for us. Our team would also like to thank the Cal Poly HVAC & R program for sponsoring our project. This project would also not be possible without the help of Dr. Peuker, who taught our team how to use Design Builder, and Robert Mooy & Thomas Kaar for creating and laying the essential groundwork the Mobile/Web app and helping us throughout the summer. We would also like to thank Cal Poly Facilities for their help with providing the HVAC information needed for developing accurate models of classrooms on campus.

Psychological Influences on Thermal Comfort Perception in Higher Education

Bora Joo & Michaella Ochotorena (SURP 2020),
Tarnvir Dhaliwal, Khanhthy Le, Carly Tudor, Victoria Vega, Carson Hubred (mentor),
Dr. Jennifer Mott Peuker (Mechanical Engineering)

Historical Trends


Our goal was to ultimately determine the influencing factors with regards to the relationship between thermal comfort and course performance. Our time was spent performing data analysis to identify and then test the significance of these variables.

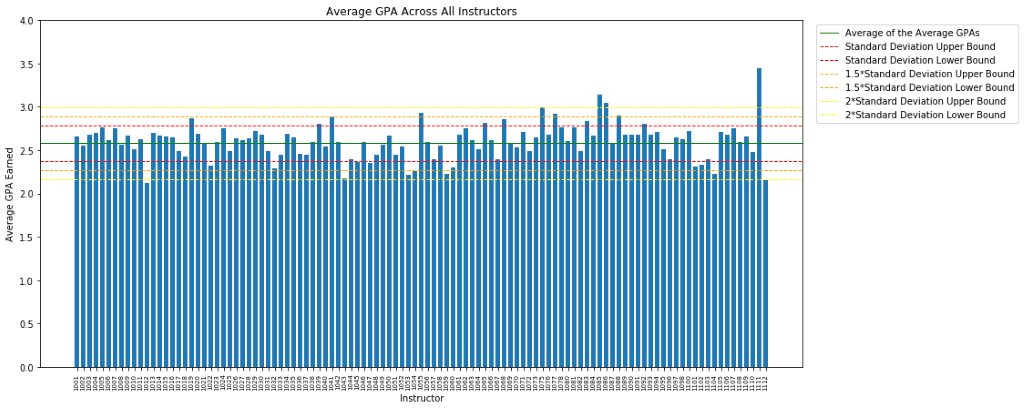
In the visual below, one can see the variance in average GPA across all instructors. The horizontal lines depict the average of the averages, as well as the population standard deviation of the data with the bounds above and below.

The visual was used to ultimately determine which instructors to eliminate based on population standard deviation and average GPAs. Outlying instructors were filtered out for the rest of the data analysis.

We compared the grades by time of day the class started. The results show that they very early morning, late evening, and surprisingly 2pm were below the average GPA. The 6:40pm GPA was the lowest by a significant amount, bringing the range of average GPAs to .5867 grade points.

We will continue to analyze the data to determine trends and the effect of temperature on performance. lllllllllllllllllllllllllllllllllllllllllllllllllllllllllllllllllllllllllllllllllllll

The graphs to below compare the recorded temperature and relative humidity of an empty classroom, the recorded temperature and relative humidity of an occupied classroom, and the outside temperature and relative humidity. 

Problem Statement

This research proposes to investigate occupant satisfaction and what influences their perception of thermal comfort, specifically the psychological effects on thermal comfort, and asks the question of whether or not we can influence people to believe that room conditions are acceptable.

Summer 2020 Goals

  1. Start analysis of historical calculus data and begin to determine trends with respect to grades and weather (which influences thermal comfort in classrooms having no AC).
  2. Model empty classrooms using Design Builder and predict conditions of full classrooms and comfort levels.
  3. Continue the CPTC Mobile/Web app to be launched for data collection Fall 2020.

Methods

Lorem ipsum dolor sit amet, consectetur adipiscing elit. Ut elit tellus, luctus nec ullamcorper mattis, pulvinar dapibus leo.fjskldfjdslfjdsljfldskfjdsklfjldksjfaerjndvcnxnvjdfaslfjdslfjdskljfldksljflkdsafjkldsfjlsdc  dfnvhjoreiv dfhev dfzxnfmdslkfkdlsafjkdslajfdjfsdjfkldasjflllllllllllllllllllllllllllllllllllllllllllllllllllllllllllllllllllllllllllllllllllllllllllllllllllllllllllllllllllllllllllllllllllllllllllllllllllllllllllllllllllllllllllllllllllllllllllllllllllllllllllllllllllllllllllllllllllllllllllllllllllllllllllllllllllllllllllllllllllllllllllllllllllllllllllllllllllllllllllllllllllllllllllllllllllllllllllllllllllllllllllllllllllllllllllllllllllllllllllllllllllllllllllllllllllllllllllllllllllllll

Predicting Room Conditions

Using the program Design Builder, we simulated multiple empty Cal Poly classrooms and validated out models with baseline data taken from those classrooms. Then we used the model to simulate what room conditions would be like in a fully occupied classroom.

Below is an example of what a classroom model (186-C102, Construction Innovations) looks like on Design Builder. The grey block is the actual classroom and the purple and green blocks are “component blocks”, used to simulate adjacent rooms or buildings and their projected shading.

As of August 2020, we validated eight Cal Poly classroom models. We will continue to collect baseline data from and model different classrooms. We will also collect room condition data from occupied classrooms that are hosting in-person labs to analyze occupant CO2 output. Additionally, we will simulate alternate HVAC strategies that can better regulate student thermal comfort and save energy.

Mobile/Web App

The mobile/web app to be used for data collection was developed using React and Ionic and is currently out on the web and the Google Play and App Stores. Users set a profile, so we know their demographics. Then they fill out a survey relating to their thermal comfort anytime while on the Cal Poly campus. The survey questions are below:

All the data is stored using Google’s Firebase and will be used for future analysis. We plan to release the app to be used for data collection by the end of the Fall 2020 academic quarter. Future improvements we would like to make include regular notifications reminding users to take the survey and adding a messaging system to influence users’ thermal comfort.

fadhsjkkkkkkkkkkkkkkkkkkkkkkkkkkkkkkkkkkkkkkkkkkkkkssssssllllllllllllllllllllllllllllllllllllllllllllllllllllllllllllllllllllllllllllllllllllllllllllllllllllllllllll

To quantify how “uncomfortable” a room can be, the Design Builder simulation calculates “discomfort hours” as defined by the ASHRAE 55 standard. 

The figure below shows the times of the day which the occupants will most likely experience discomfort in each room.

These simulation results are likely too high. ASHRAE Standard 55 uses several factors in its calculation for discomfort, one of which is relative humidity. Given that the simulation relative humidity results of the baseline models have a 20% difference from recorded data, the discomfort calculations are also flawed. As we continue with this research, we will refine the baseline models to provide more accurate discomfort hour results.

Want to Learn More?

We have a webpage on the mechanical engineering department’s website! Click the button below to learn more about our project, keep up with the current status of our research, and take the thermal comfort perception survey on the CPTC Web App.

Our Project Visuals

Share

Share on facebook
Share on twitter
Share on linkedin

Coronavirus Update and Resources