Meet the Team

Jack Rocca
M.S. Business Analytics Student, Industrial Engineering Graduate
Jack is a Cal Poly Industrial Engineering graduate and current Master’s Student in the Business Analytics program. With a passion for both engineering and data science, Jack has focused on figuring out ways in which companies can leverage their data to increase decision-making abilities. In the SURP project with Boeing, Jack focused on creating new variables and KPIs from the RFID data to derive meaningful insights. In his free time, Jack enjoys surfing, playing golf, and rooting for the San Francisco Giants and Golden State Warriors.

Mitchell Fong
Industrial Engineering Student
Mitchell is a second year student from San Jose. He is majoring in industrial engineering at California Polytechnic, San Luis Obispo. He has worked on projects involving data analysis and supply chain and also hopes to pursue a Master’s degree in Industrial Engineering. In this SURP project, Mitchell focused on cleaning and reorganizing the data via python, as well as creating data visualizations in Tableau. In his free time, Mitchell loves to play sports, especially basketball and golf.
Acknowledgements
We would like to thank Boeing and the SURP Program at Cal Poly for giving us the opportunity to conduct our research on this fascinating topic.
We would also like to thank our sponsor advisors, Helen Owens – Boeing Technical Lead Engineer, Jim Freitas – Boeing VP, Customer Support META, our faculty mentor, Dr. Mohammed Awwad, and project member Rupal Totale for all their support throughout the project.
Please Watch the Video Below to Learn About Our Project!
Our Project's Digital Poster
Project Overview


Radio frequency identification (RFID) is a technology that can identify and track tags attached to objects using electromagnetic fields. Throughout Boeing’s main supply chain & logistics facilities, RFID technology is used to track the movement of their inventory, tools, machinery, and employees.
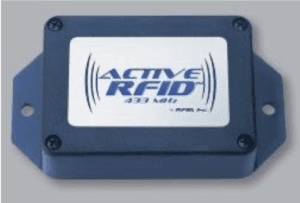
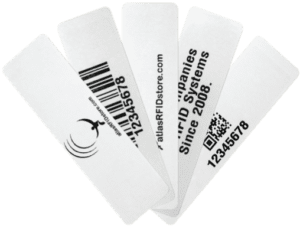
Before looking at Boeing’s operations, we first needed to understand ”Passive” RFIDs and “Active” RFIDs. Passive RFIDs do not have a battery and are tracked only when they cross the electromagnetic field of a sensor. Active RFIDs have a battery and transmitter, allowing them to continuously transmit their own signal. While they are more expensive, with Active RFIDs it is possible to track a tag’s realtime location.
Presently, at Boeing, RFID data streams are primarily utilized for inventory management purposes such as determining accuracy of inventory count and deriving insight on material flow. The purpose of this research is to investigate ways of analyzing the immense volume of RFID data for items within Boeing’s facilities to enable better decision-making processes within the supply chain.
Looking at the data, we wanted to envision what insights would be beneficial and figure out how a data pipeline could be created to meet these goals. Below are the original concepts we hoped to achieve.
- Inventory flows and availability at different stages of the supply-chain
- Frequent paths that products travel within facilities
- Identification of dead zones or zones with too much activity
- Most active hours times of the day, week, and month
Methodology
Fundamental to our project was the ability to process and visualize the data produced by Boeing’s RFID system. To do this, our group used R and R Studio as well as Tableau, performing the following tasks in each:

- Completed Exploratory Data Analysis (EDA) utilizing R’s Tidyverse , Lubridate, and Slider packages.
- Derived new variables from the original data set to increase the detail of the data.

- Created an array of graphs and visuals to better interpret RFID movement.
- Generated an interactive user dashboard to easily sort and view insights from the data
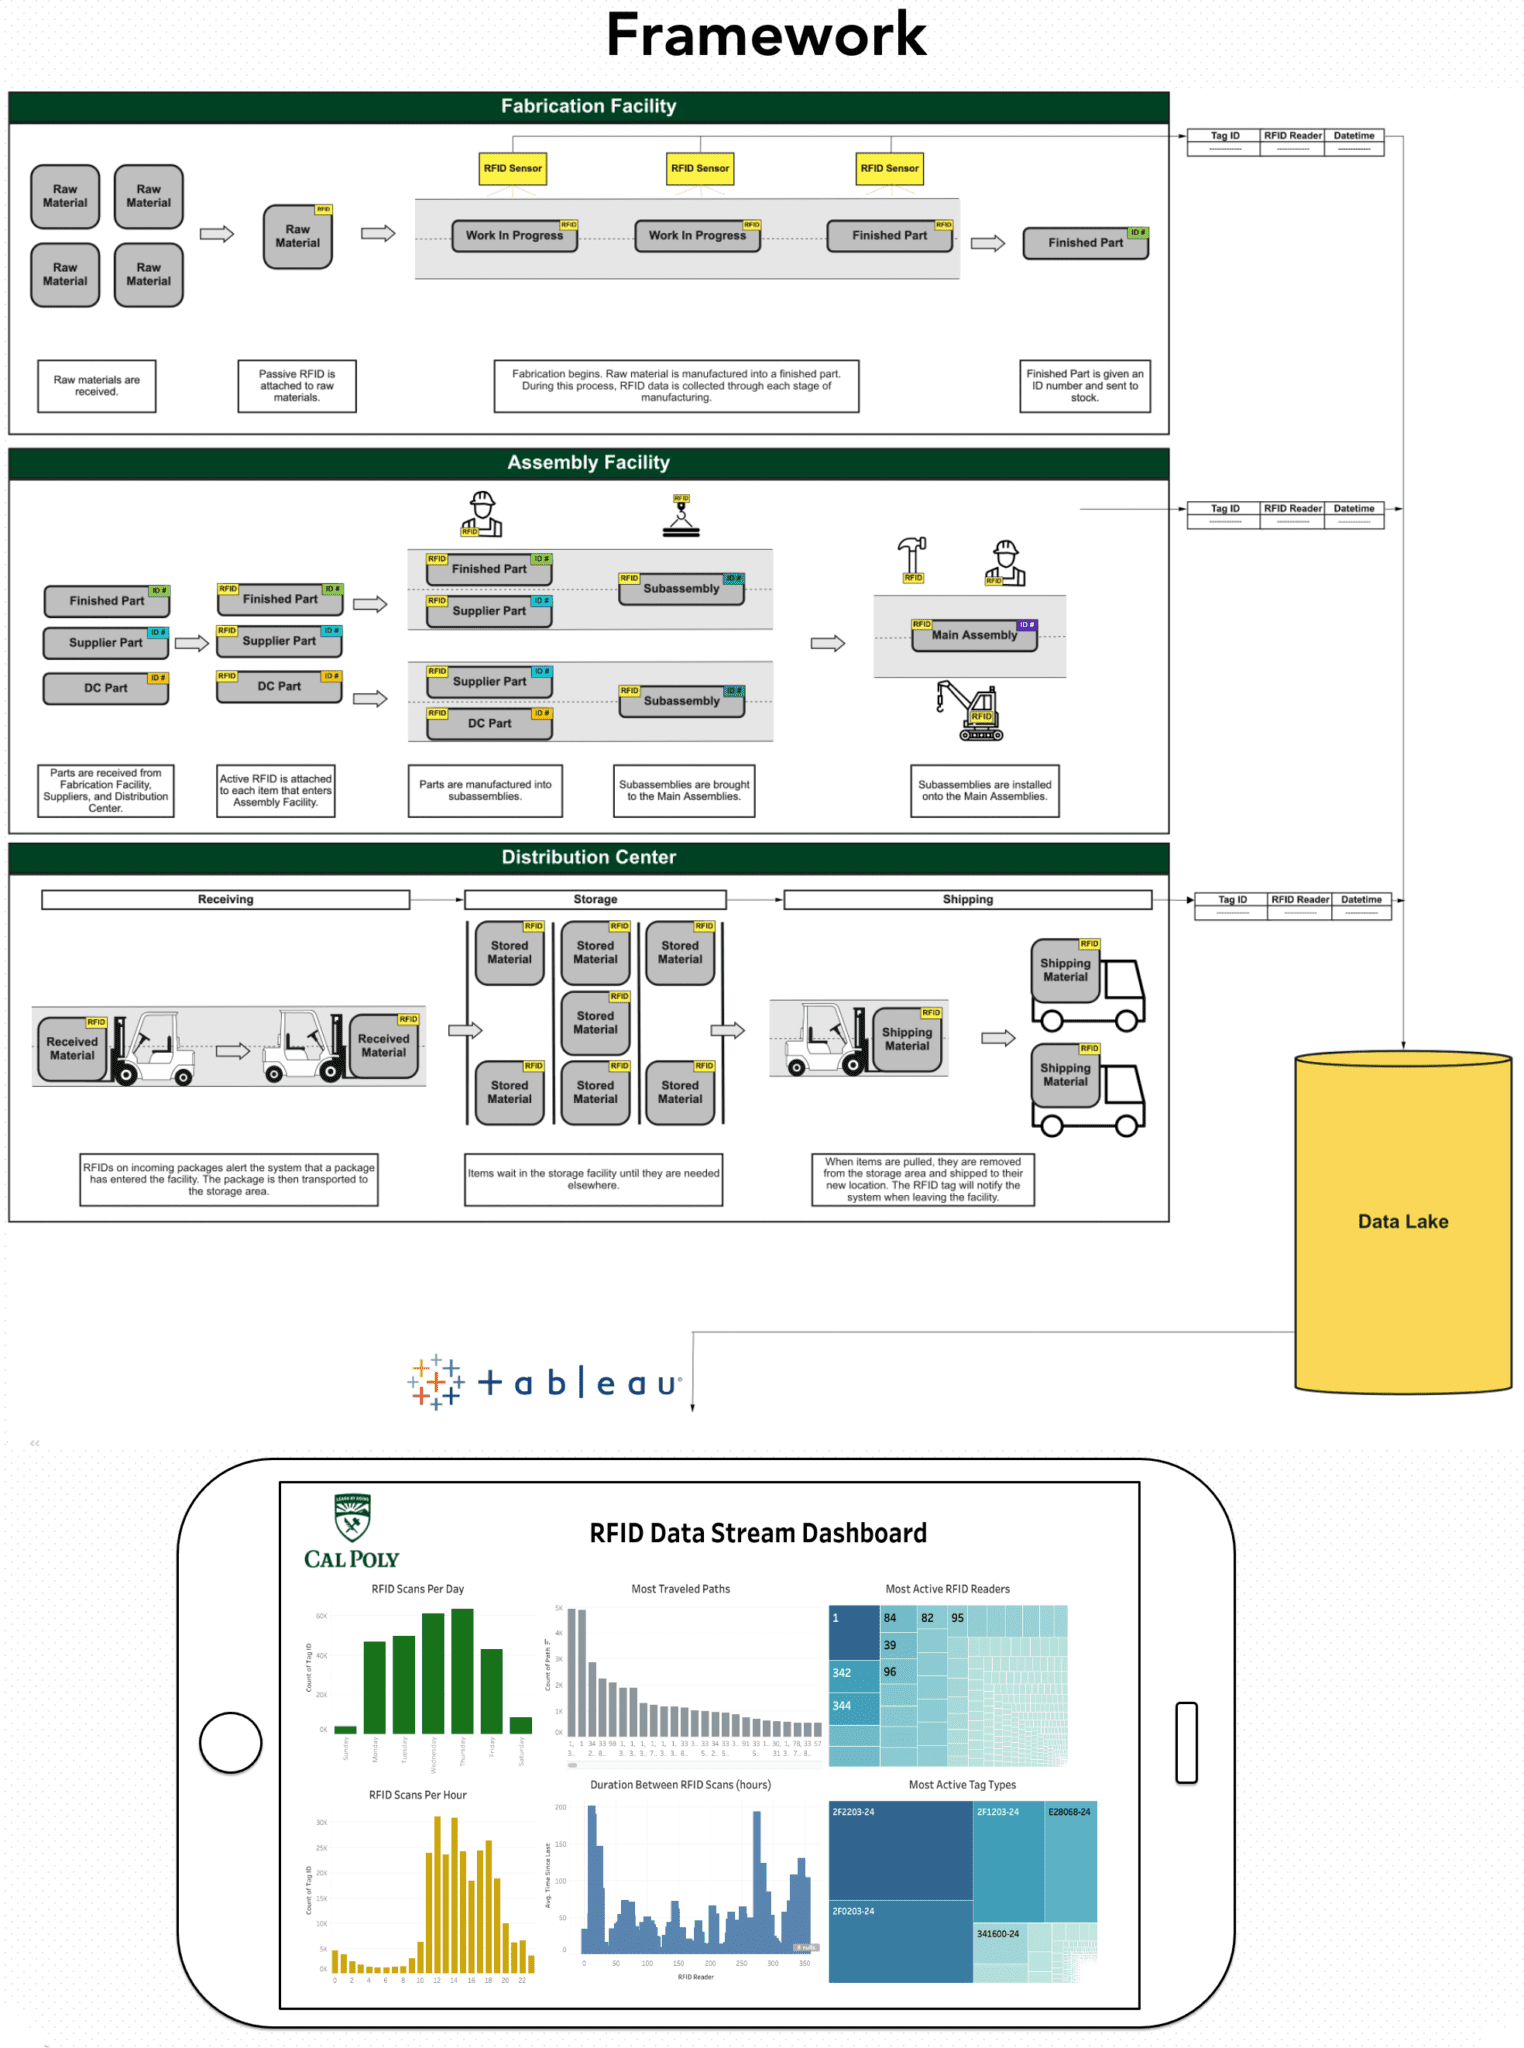
Framework

Data
Main Data File

The above data file is a glimpse of the roughly 300,000 data points collected from the RFID system in the month of June. The first three columns are from the original data stream, and the other 6 were columns we created to derive more insight on the data. All of our data cleaning, manipulation, and wrangling was completed in R. Many of the new variables were what allowed for easy integration and visualization within Tableau. Below is a list of the variables and their specific meanings.
Variables
Conclusion
Analyzing Boeing’s RFID data stream to derive meaningful, clear insights was challenging. First, our team needed to understand the fundamental functions of RFID technology as well as the nature of supply chain and logistics operations at Boeing. Once this was understood, our team utilized the R programming language to rework the data and create new, impactful variables. Lastly, data visualization methods were conducted in Tableau to allow for future stakeholders to easily interpret how materials, tools, and people move within Boeing’s facility. Not only are these charts easily viewable, but they are interactive and can allow for anyone to find the exact information they are curious about. Our hope is that this information will increase efficiency and drive innovation within their supply chain and logistics operations.

